Thursday, March 31, 2011
Invest Indonesia-CIMB and BBTN
BNGA.JK - RP1780 CIMB-Niaga found good support at Rp1650 level (12x PER) and moving steadily toward Rp1850 and Rp2000. Still not too late to accumulate this 5th largest bank in Indonesia. BBTN.JK - Rp1680 ( refer to write-up on 20-2-2011) Break target price for level 1 Rp1600. Next target price Rp1850.
Monday, March 28, 2011
Invest Indonesia:- CIMB-NIAGA..Riding on Indonesia Growth Story
CIMB-Niaga currently trading at 12.5x PER for forward earning year 2011 ( estimate to earn Rp137 per share ). Start to accumulate at this level.
Target Price : Rp2055 based on 15X PER of FY2011. ( potential upside 19% )
Rp2190 based on 16X PER of FY2011 (potential upside 27%)
Target Price : Rp2055 based on 15X PER of FY2011. ( potential upside 19% )
Rp2190 based on 16X PER of FY2011 (potential upside 27%)
Monday, March 21, 2011
KFIMA-(6491) - RM1.58
What will be the share price if the following happened for coming 1-2 years ?
Year EPS (sen) DPS (sen)
2010 22.32 5.00 9M2010 EPS = 19.86, estimated 12M2010 EPS= atleast 25 sen
2011 25.00 10.00* *estimation
2012 30.00 15.00*
KFIMA 3 Years P/L Track Record:
Note: Cash balance approximately RM200 million or cash per share of RM0.76 and still building up because of cash dividend flow in from FIMACOR (3107) and consistent earning from plantation segment.
Target Price:
1. RM2.00 based on 8x PER for FY2011
2. RM2.00 based on dividend yield of 5% based on 10 sen dividend payout in 2011
3. RM2.00 - RM2.50 based on dividend yield of 5% if dividend payout 15 sen in year 2012.
GOOD LUCK!
Year EPS (sen) DPS (sen)
2010 22.32 5.00 9M2010 EPS = 19.86, estimated 12M2010 EPS= atleast 25 sen
2011 25.00 10.00* *estimation
2012 30.00 15.00*
KFIMA 3 Years P/L Track Record:
| PROFIT & LOSS | @ 2010-03-31 | @ 2009-03-31 | @ 2008-03-31 |
| CURRENCY | MYR | MYR | MYR |
| TURNOVER | 410,447 | 369,070 | 308,712 |
| OPERATING PROFIT | 108,538 | 74,770 | 55,279 |
| PROFIT/LOSS BEFORE TAX | 115,726 | 81,193 | 56,862 |
| NET PROFIT/LOSS TO SHAREHOLDERS | 58,749 | 46,160 | 30,287 |
| ( Inclusive of ) | |||
| Depreciation | (19,451) | (16,346) | (14,467) |
| Interest | (4,163) | (4,976) | (3,828) |
| Taxation | (29,293) | (10,566) | (13,588) |
| *All figures in '000 | |||
| GROSS EPS (CENT/SEN) | 22.32 | 17.54 | 11.51 |
| DIVIDEND CURRENCY | MYR | MYR | MYR |
| GROSS DIVIDEND | 0.05 | 0.03 | 0.03 |
Note: Cash balance approximately RM200 million or cash per share of RM0.76 and still building up because of cash dividend flow in from FIMACOR (3107) and consistent earning from plantation segment.
Target Price:
1. RM2.00 based on 8x PER for FY2011
2. RM2.00 based on dividend yield of 5% based on 10 sen dividend payout in 2011
3. RM2.00 - RM2.50 based on dividend yield of 5% if dividend payout 15 sen in year 2012.
GOOD LUCK!
Friday, March 18, 2011
Golden Agri (E5H.SI)
Background:- Share Price : SGD 0.64
Golden Agri-Resources Ltd is the world's second largest palm oil plantation with a total planted area of 442,500 hectares (including small holders) as at 31 December 2010, located in Indonesia. It has integrated operations focused on the production of palm-based edible oil and fat.
Founded in 1996, GAR is listed on the Singapore Exchange since 1999 with a market capitalisation of US$7.5 billion as at 31 December 2010. Flambo International Ltd, an investment company owned by the Widjaja Family, is GAR's largest shareholder, with a 49.6% stake in the company. GAR has several subsidiaries, including PT SMART Tbk ("SMART") and PT Ivo Mas Tunggal. SMART listed its shares on the Indonesia Stock Exchange in 1992.
GAR is focused on sustainable palm oil production. In Indonesia, its primary activities include cultivating and harvesting of oil palm trees; processing of fresh fruit bunch into crude palm oil ("CPO") and palm kernel; and refining CPO into value-added products such as cooking oil, margarine and shortening. Through its subsidiaries, GAR operates 36 palm oil processing mills, four refineries and six kernel crushing plants. It also has an integrated operation in China including a deep sea port, oilseed crushing plants, production capabilities for refined edible oil products as well as other food products such as noodles.
corporate website: http://www.goldenagri.com.sg
Note : excluding biological asset revaluation, the normalised net profit should be around USD387 million for 2010.
The targeted net profit for 2011 = USD420 million OR EPS of USD0.035 (SGD 0.0448)
USD 1 =SGD 1.28
Therefore, GAR share price currently trading at FY2011 PER of 14x. Any price downward adjustment provide opportunity to accumulate this counter.
Support level 1 - SGD0.585 (PER 13X)
Support level 2 - SGD0.540 (PER 12x)
Target price for GAR =SGD 0.72 - SGD0.80 level for coming 1 year based on PER 16X-18X.

Golden Agri-Resources Ltd is the world's second largest palm oil plantation with a total planted area of 442,500 hectares (including small holders) as at 31 December 2010, located in Indonesia. It has integrated operations focused on the production of palm-based edible oil and fat.
Founded in 1996, GAR is listed on the Singapore Exchange since 1999 with a market capitalisation of US$7.5 billion as at 31 December 2010. Flambo International Ltd, an investment company owned by the Widjaja Family, is GAR's largest shareholder, with a 49.6% stake in the company. GAR has several subsidiaries, including PT SMART Tbk ("SMART") and PT Ivo Mas Tunggal. SMART listed its shares on the Indonesia Stock Exchange in 1992.
GAR is focused on sustainable palm oil production. In Indonesia, its primary activities include cultivating and harvesting of oil palm trees; processing of fresh fruit bunch into crude palm oil ("CPO") and palm kernel; and refining CPO into value-added products such as cooking oil, margarine and shortening. Through its subsidiaries, GAR operates 36 palm oil processing mills, four refineries and six kernel crushing plants. It also has an integrated operation in China including a deep sea port, oilseed crushing plants, production capabilities for refined edible oil products as well as other food products such as noodles.
corporate website: http://www.goldenagri.com.sg
| By the Numbers | USD (Currency in Millions) | ||||
| Employee | 31448 | ||||
| Issued Share (in Millions) | 12138.676942 | ||||
| Total Debt | $984.35 | ||||
| Cash Balance | $275.84 | ||||
| Revenue | $3504.66 | ||||
| Revenue Growth (1yr) | 52.80% | ||||
| Revenue Growth (5yr) | 33.73% | ||||
| Operating Margin | 54.46% | ||||
| Operating Margin Growth (1yr) | 54.46% | ||||
| Operating Margin Growth (5yr) | 55.18% | ||||
| Net Margin | 41.29% | ||||
| Management | |||||
| Executive Chairman of the Board, Chief Executive Officer | Franky Widjaja | ||||
| President, Director | Muktar Widjaja | ||||
| Chief Financial Officer, Director | Simon Lim | ||||
| Executive Director | Rafael Concepcion | ||||
| Key Numbers | USD (Currency in Millions) |
| Income Statement | |||||
| Total Revenue | $3504.66 | ||||
| Gross Profit | $954.59 | ||||
| Total Operating Expense | $1595.97 | ||||
| Operating Income | $1908.69 | ||||
| Net Income before taxes | $1929.18 | ||||
| Net Income after taxes | $1447.15 | ||||
| Net Profit Margin | 41.29% | ||||
| Balance Sheet | |||||
| Total Assets | $10114.45 | ||||
| Current Assets | $1491.91 | ||||
| Total Liabilities | $3288.59 | ||||
| Current Liabilities | $1060.90 | ||||
| Long Term Debt | $443.64 | ||||
| Total Debt | $984.35 | ||||
| Total Equity | $6825.86 | ||||
| Cash Flows | |||||
| Cash from Operating Activities | $167.41 | ||||
| Cash from Investing Activities | $(469.79) | ||||
| Cash from Financing Activities | $184.37 | ||||
| Net Change in Cash | $(118.00) | ||||
| Total Revenue (Millions) | Q1 | Q2 | Q3 | Q4 | 12 months |
| 2010 | $624.53 | $726.22 | $964.74 | $1189.16 | $3504.66 |
| 2009 | NA | NA | NA | $643.08 | $2293.70 |
| Net Income (Millions) | Q1 | Q2 | Q3 | Q4 | 12 months |
| 2010 | $88.52 | $66.05 | $99.17 | $1169.30 | $1423.04 |
| 2009 | NA | NA | NA | $472.73 | $606.96 |
Note : excluding biological asset revaluation, the normalised net profit should be around USD387 million for 2010.
The targeted net profit for 2011 = USD420 million OR EPS of USD0.035 (SGD 0.0448)
USD 1 =SGD 1.28
Therefore, GAR share price currently trading at FY2011 PER of 14x. Any price downward adjustment provide opportunity to accumulate this counter.
Support level 1 - SGD0.585 (PER 13X)
Support level 2 - SGD0.540 (PER 12x)
Target price for GAR =SGD 0.72 - SGD0.80 level for coming 1 year based on PER 16X-18X.
GAMUDA BERHAD-(CODE:5398)
Background:-
Gamuda is a leader in turnkey and B.O.T. civil engineering infrastructure and township development, with projects and investments in South East and Far East Asia, Indochina, South Asia and the Middle East.
for Gamuda corporate website: http://www.gamuda.com.my
Trading Strategy For Gamuda- WD (RM1.35):-
Expiry Date : Year 2015
Exercise Price= RM2.66
Gamuda : Target price given by some broker house range from 4.20-4.80 level.
If you think Gamuda futures performance will be able to benefited from Malaysia construction project e.g Mass Rapid Transit (MRT) and tunneling works of which Gamuda already has good track record ( includes the SMART Tunnel, Penchala Tunnel and Kaohsiung MRT). Then the Gamuda share price may be able to go up to RM4.20 - RM4.80 level from now on till the next 2-3 years.
Therefore, buying into Gamuda-WD may provide good return and leveraging effect.
Assuming Gamuda shares price go up from RM3.60 - RM4.30 and :
Note: the 10% premium given because Gamuda-WD will only expired in another 4 years.
6 month high and low price :-
Gamuda 3.46 -4.26
Gamuda-WD 1.29 - 1.82
Good Luck !
Gamuda is a leader in turnkey and B.O.T. civil engineering infrastructure and township development, with projects and investments in South East and Far East Asia, Indochina, South Asia and the Middle East.
We have delivered more than USD3billion of civil infrastructure, operate and maintain 230km of highways that serve more than two million road users daily, provide water supply to more than 2 million consumers as well as built more than 14,000 homes in our lifestyle townships.
Our scope of expertise covers highways and expressways, bridges, tunnels, dams and hydropower, hydraulic engineering and water treatment, railways and mass-rapid transit systems, marine works and ports, and building, which are delivered through general contracting, design & build, turn-key, as well as Build–Operate–Transfer methods.
We are also a major township and property developer with four township projects that will eventually provide more than 30,000 homes when completed.
Our emphasis on differentiation and value-creation, as well as on operational excellence has enabled the group to consistently deliver distinctive infrastructure and homes bearing Gamuda’s hallmark traits of innovation, superior quality, outstanding value and assured completion.for Gamuda corporate website: http://www.gamuda.com.my
Trading Strategy For Gamuda- WD (RM1.35):-
Expiry Date : Year 2015
Exercise Price= RM2.66
Gamuda : Target price given by some broker house range from 4.20-4.80 level.
If you think Gamuda futures performance will be able to benefited from Malaysia construction project e.g Mass Rapid Transit (MRT) and tunneling works of which Gamuda already has good track record ( includes the SMART Tunnel, Penchala Tunnel and Kaohsiung MRT). Then the Gamuda share price may be able to go up to RM4.20 - RM4.80 level from now on till the next 2-3 years.
Therefore, buying into Gamuda-WD may provide good return and leveraging effect.
Assuming Gamuda shares price go up from RM3.60 - RM4.30 and :
| Potential Return | |||
| Gamuda | Intrinsic Value | 10% Premium | Current Price |
| Shares Price | 2.66 | 2.66 | 1.35 |
| 3.60 | 0.94 | 1.30 | -4% |
| 3.70 | 1.04 | 1.41 | 4% |
| 3.80 | 1.14 | 1.52 | 13% |
| 3.90 | 1.24 | 1.63 | 21% |
| 4.00 | 1.34 | 1.74 | 29% |
| 4.10 | 1.44 | 1.85 | 37% |
| 4.20 | 1.54 | 1.96 | 45% |
| 4.30 | 1.64 | 2.07 | 53% |
6 month high and low price :-
Gamuda 3.46 -4.26
Gamuda-WD 1.29 - 1.82
Good Luck !
Tuesday, March 15, 2011
Simple Investment Model- For Uncertainty In The Market
On Tuesday March 15, 2011, 10:13 am EDT
INVESTORS CONCERN: WHEN CAN I ENTER THE MARKET?
My advise will be : get ready to invest and most of the time we won't be able to know the market can go down to which level. What we can control is our investment strategies. But before we move on to investing, it is good to know the following:
1. Know the amount that set aside for investment.
2. Know the potential risk/losses that you willing to take. (worst case scenario, at least to hold for 2-3 years)
3. Know the number of counters you ready to invest. (also depend on your investment amount)
4. Know the number of quantity in each counters you ready to invest.
5. Apply some dollar cost averaging method as follows:
Simple Investment Method (SIM) 1-2-3-6
2. Whenever the economy recover, equity market tend to rebound 20-50% from the bottom.
3. The recovery will be very strong and at least for 3-5 years.
4. Invest in fundamentally sound companies with solid business model .
Let us divide our investment amount into 12 portions (1+2+3+6=12).
Example : RM120,000 investment amount
Timing to enter market:-
1. If market drop 5% - invest RM10K
2. Market drop another 5%-invest RM20K
3. Market drop another 5%-invest RM30K
4. Market drop another 5%-invest RM60K
GOOD LUCK!
Remarks:
1. Use your own strategy of which can let you feel more comfortable instead of trying to guess the right timing to enter market.
2.The above investment strategy allow you to exist either in step 1,2,3 or 4 whenever there is a technical rebound take place and the portfolio is making money.
...Stocks opens sharply lower, bond prices rise, as nuclear crisis in Japan intensifies
INVESTORS CONCERN: WHEN CAN I ENTER THE MARKET?
My advise will be : get ready to invest and most of the time we won't be able to know the market can go down to which level. What we can control is our investment strategies. But before we move on to investing, it is good to know the following:
1. Know the amount that set aside for investment.
2. Know the potential risk/losses that you willing to take. (worst case scenario, at least to hold for 2-3 years)
3. Know the number of counters you ready to invest. (also depend on your investment amount)
4. Know the number of quantity in each counters you ready to invest.
5. Apply some dollar cost averaging method as follows:
Simple Investment Method (SIM) 1-2-3-6
Assumption:
1. If economy may deteriorating due to Japan nuclear effect, the equity market may drop up to 30%.2. Whenever the economy recover, equity market tend to rebound 20-50% from the bottom.
3. The recovery will be very strong and at least for 3-5 years.
4. Invest in fundamentally sound companies with solid business model .
Let us divide our investment amount into 12 portions (1+2+3+6=12).
Example : RM120,000 investment amount
Timing to enter market:-
1. If market drop 5% - invest RM10K
2. Market drop another 5%-invest RM20K
3. Market drop another 5%-invest RM30K
4. Market drop another 5%-invest RM60K
Look for company with potential to pay out dividend for next 1-6 months to get some dividend income during this period of time.
GOOD LUCK!
Remarks:
1. Use your own strategy of which can let you feel more comfortable instead of trying to guess the right timing to enter market.
2.The above investment strategy allow you to exist either in step 1,2,3 or 4 whenever there is a technical rebound take place and the portfolio is making money.
Friday, March 11, 2011
Japanese earthquake and Stock Market Outlook
Japanese Stocks Unlikely To Slump for Long: Strategist
(news from CNBC)While it's still very early to tell what the impact of the Japanese earthquake will be, it is likely that the events won't derail the country's stock market, Olgerd Eichler, co-head of asset management at MainFirst Asset Management, told CNBC Friday.
Looking back at the 1995 earthquake centered around Kobe, where more than 6,000 died, the stock markets only took a few days to recover, Eichler said.
"I think it's not going to derail equities for the next several weeks," he said.
Short-term impacts will include losses for insurers, possibly higher oil prices and increased uncertainty, he said.
"But we are living in a world with many uncertainties now," he added.
Globally, there will still be a "very decent growth rate and it's not going to fall apart," Eichler said.
© 2011 CNBC, Inc. All Rights Reserved
Thursday, March 10, 2011
INVESTMENT MODEL - SIM
If you are worry about the uncertainty ahead of you, the following investment methodology may be able to give you some tips:
http://traderszone4u.blogspot.com/2009/02/using-sim-1-2-3-6.html
http://traderszone4u.blogspot.com/2009/02/using-sim-1-2-3-6.html
Investor Lessons As Bull Market Turns Two
Investor Lessons As Bull Market Turns Two
by David CallawayWednesday, March 9, 2011
Commentary: History is still a great teacher
SAN FRANCISCO (MarketWatch) — Turns out the Dow Jones Industrial Average didn't go to 3,000. The bank and auto-industry bailouts didn't bankrupt the country. And the investment-banking business on Wall Street didn't collapse like a house of derivatives-marked cards after Lehman Brothers imploded.
On the two-year anniversary of the start of the bull market this week, it's worthwhile for investors to pause and reflect on some of the lessons we've learned since the great financial crisis of 2008 and early 2009.
Back on March 9 two years ago, gloom was overwhelming in the markets. Buy-and-hold investing had been declared dead. With stocks down 50% or 60% in the previous 18 months, and having fallen six months in a row, many investors were convinced the markets wouldn't come back in their lifetimes.
Older retirees and many investors had sold that January or February, at what we know now was precisely the wrong time to get out of the market. The pain of seeing their life's savings depleted in investment statements month after month after month had just become too great.
A relentless stream of triple-digit down days in the market contributed to the soul-destroying talk of unemployment, recession, depression and political chaos in Washington. A new president, who inherited the bailout program from his predecessor, struggled to maintain those policies — which proved correct — while a frustrated nation turned its ire on him.
And then, on a spring Monday of no real significance at the time, stocks bottomed out. Over the next few weeks the market would rise 20% as investors watched and argued about whether it was just another in a long line of false bottoms. It wasn't.
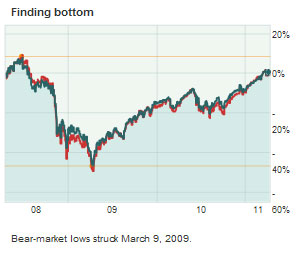
The painfully slow global recovery we've witnessed over the past two years, only now even starting to take hold, had been seen by the collective market at that point, even though nobody understood it at the time. That's the thing about turning points: You never see them coming.
Over the coming 24 months, the Dow Jones Industrial Average and S&P 500 Index would almost double, gold would add hundreds of dollars an ounce to a new record above $1,400 an ounce. And oil, whose massive rally had highlighted most of the decade before the crisis, went into hibernation until just eight weeks ago.
All of this against a backdrop of fear and concern about soaring deficits, the fragility of the world's major banks, Iran's nuclear capabilities and intentions, and the future of the entire European single-currency project.
At the same time, we've become enthralled by the iPad, and Twitter, and all the potential that the mobile revolution brings to how we live our lives — and, in the case of North Africa and the Middle East, how technology can effect social and political change.
The lessons for investors should not be forgotten. Buy-and-hold investment strategies did not survive for decades because they were fads. Investors who didn't sell and held on — indeed, continued to dollar-cost average — did quite well over the last few years.
Diversified portfolios will help capture the best market moves, gold and emerging markets in this case, while hedging against the worst, oil and blue chips during this cycle. And, most important, that the daily noise of news, opinion and protest we all live with, and which grows louder as we increasingly connect ourselves, often needs to be blocked out when making long-term or even short-term financial decisions.
Some people think anniversaries, like stock-market milestones, are just arbitrary dates and numbers that have little significance. But it's worth a moment to look up from our BlackBerrys on this one and think about how far we've come since those gloomy times two years ago. And how far we still have to go.
David Callaway is editor-in-chief of MarketWatch.
Thursday, March 3, 2011
Strategy During Uncertainty
MALAYSIA MARKET
AEONCR (5139)
Prices maintain well at RM3.80 level. It is time to pick up this counter before dividend annoucement in April 2011 ( within 2 months). Expect to announce dividend of 13 sen for April 2011 and another 12 sen in Sept 2011. Therefore, dividend for 2011 will be 25 sen and provide dividend yield of 6.5%.
KFIMA (6491)
Prices drop even good financial result was released on 28/2/2011. However, we shouldn't worry as the fundamental of this counter still intact. Continue to accumulate.
INDONESIA MARKET
BBTN.JK ( Indonesia:- Bank Tabungan Negara )
Price start to move to Rp1470 (+9.7%) since recommendation on 20-2-2011 (Rp1340). Accumulate when price weaken to Rp1420 and below.
EXCL.JK (Indonesia :- XL Axiata )
Today closed at Rp5900 (13.4%) since recommendation on 13-2-2011 (Rp5200). Accumulate when price weaken to Rp5600 and below.
BNGA.JK (Indonesia :- CIMA Niaga)
Accumulate at this level Rp1720 as this price trading at PER of 12.5x based on forecast FY2011 EPS of Rp137.
Subscribe to:
Posts (Atom)